Donut AI-Powered Chart Analysis
1. Chart Analysis with Auto-Drawing Lines
Using /analyze_chart, the system can automatically analyze charts and draw key levels.
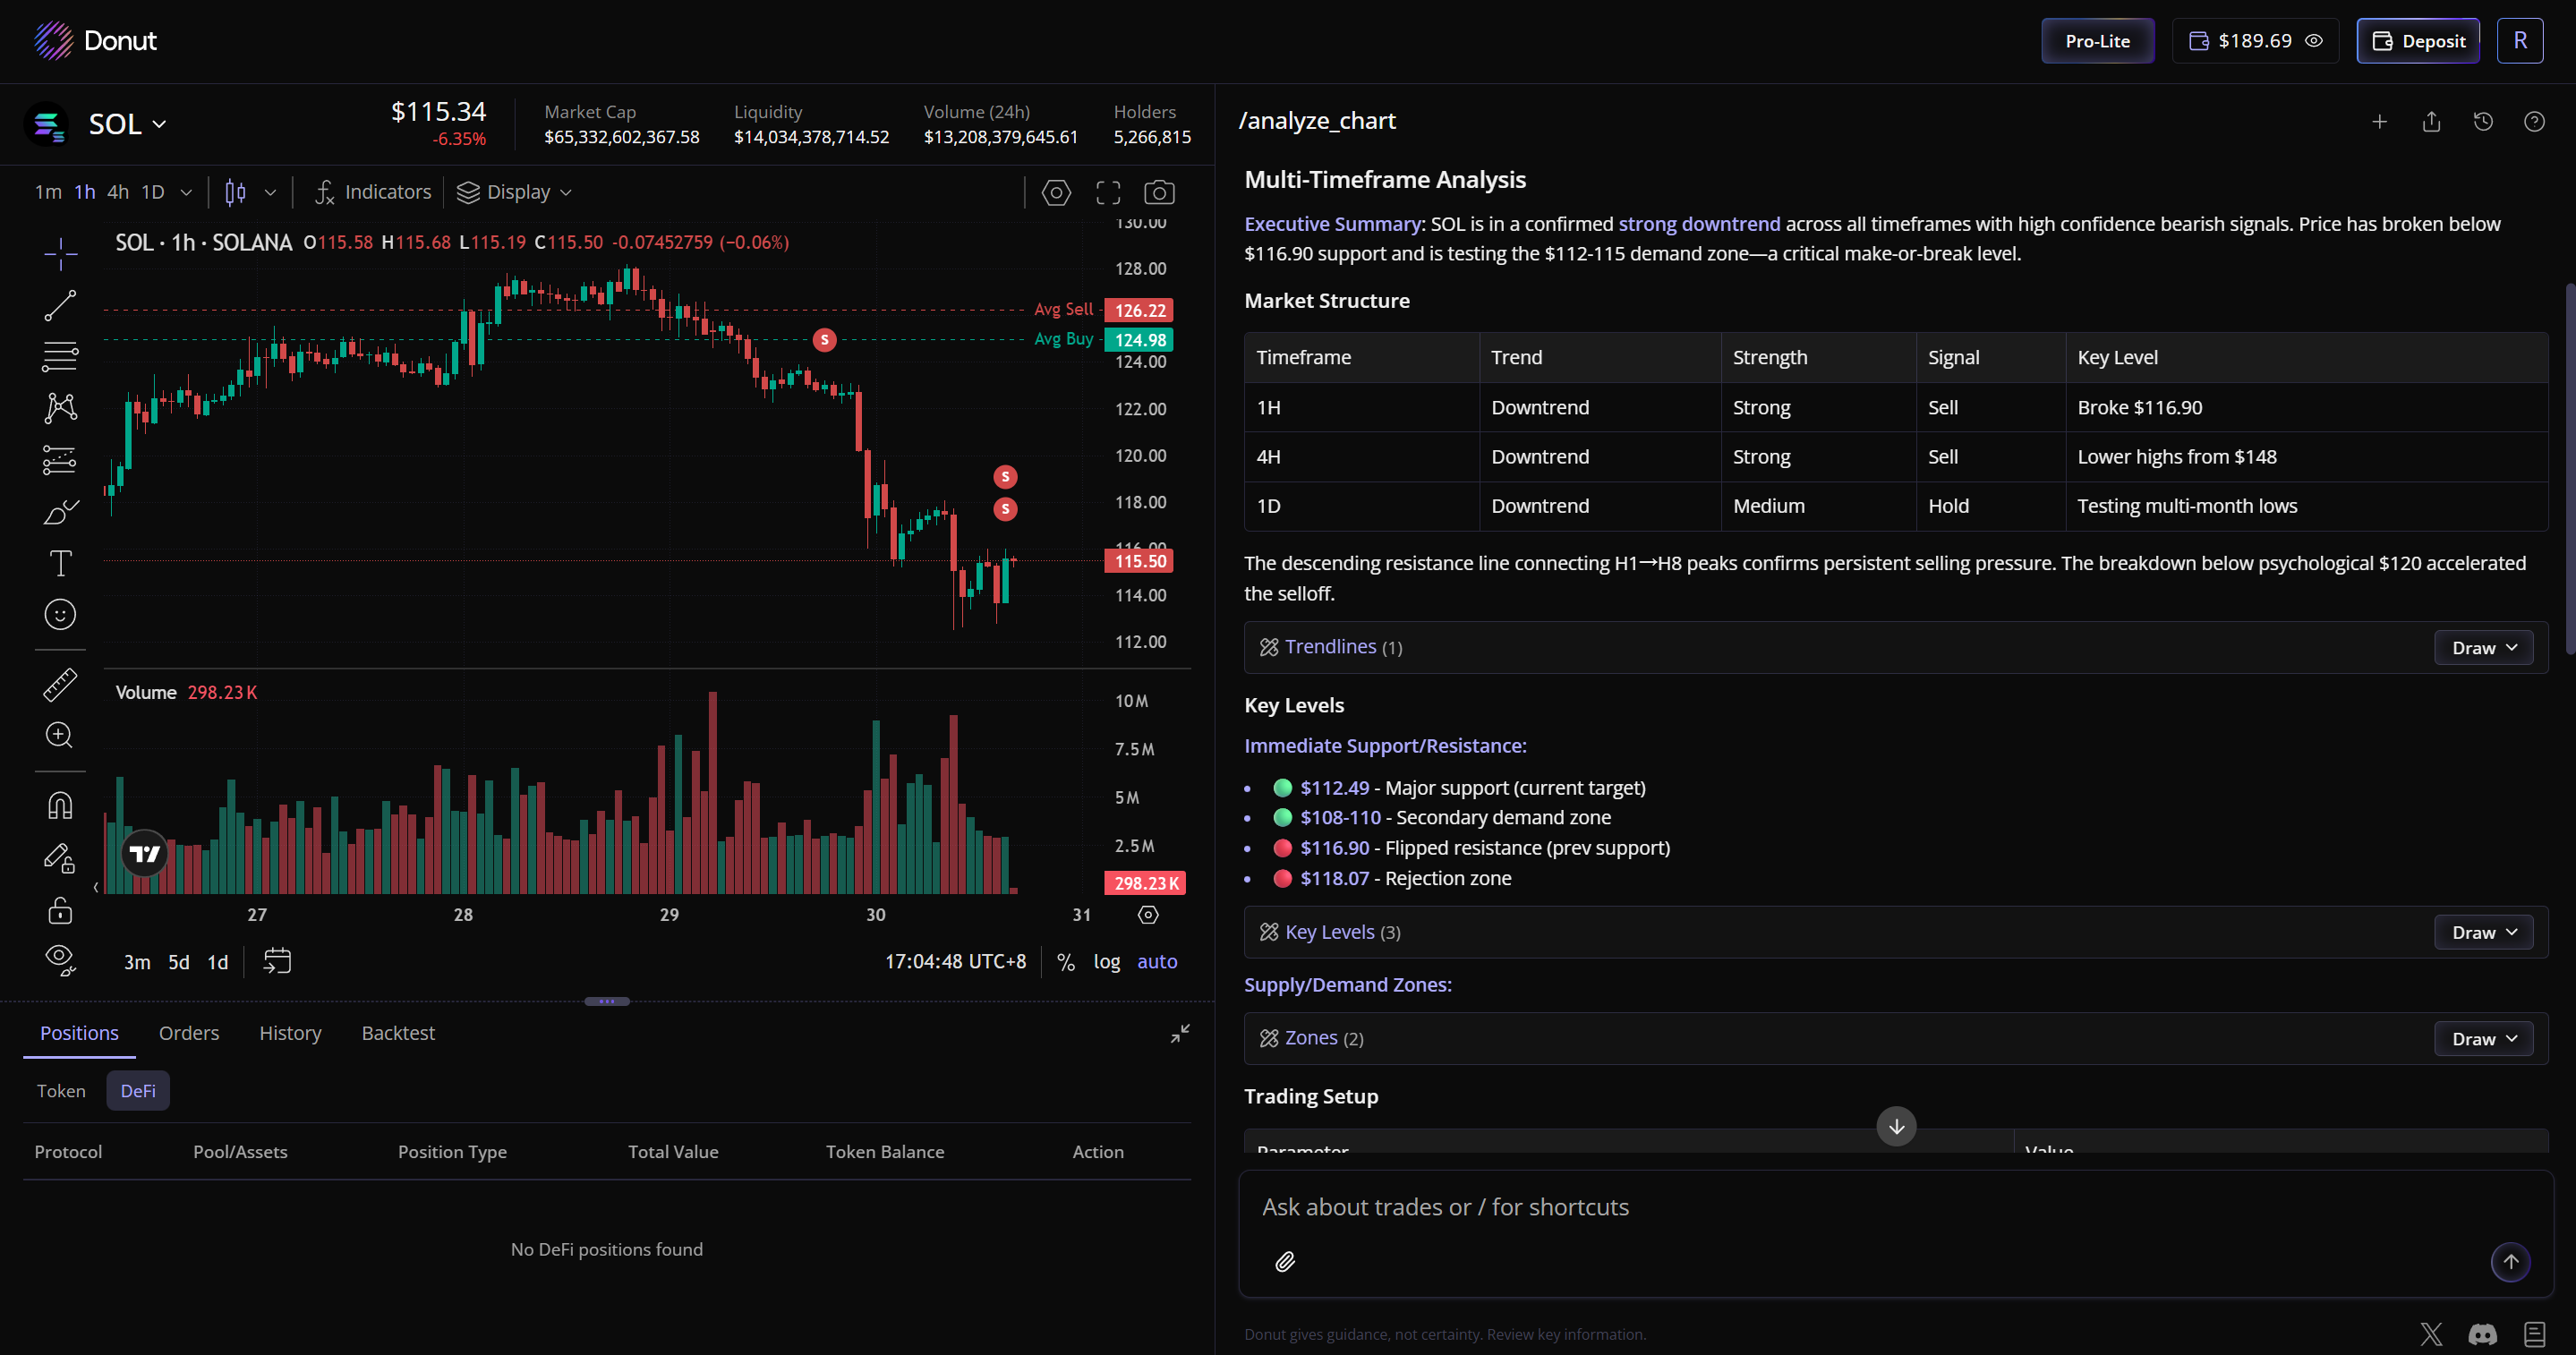
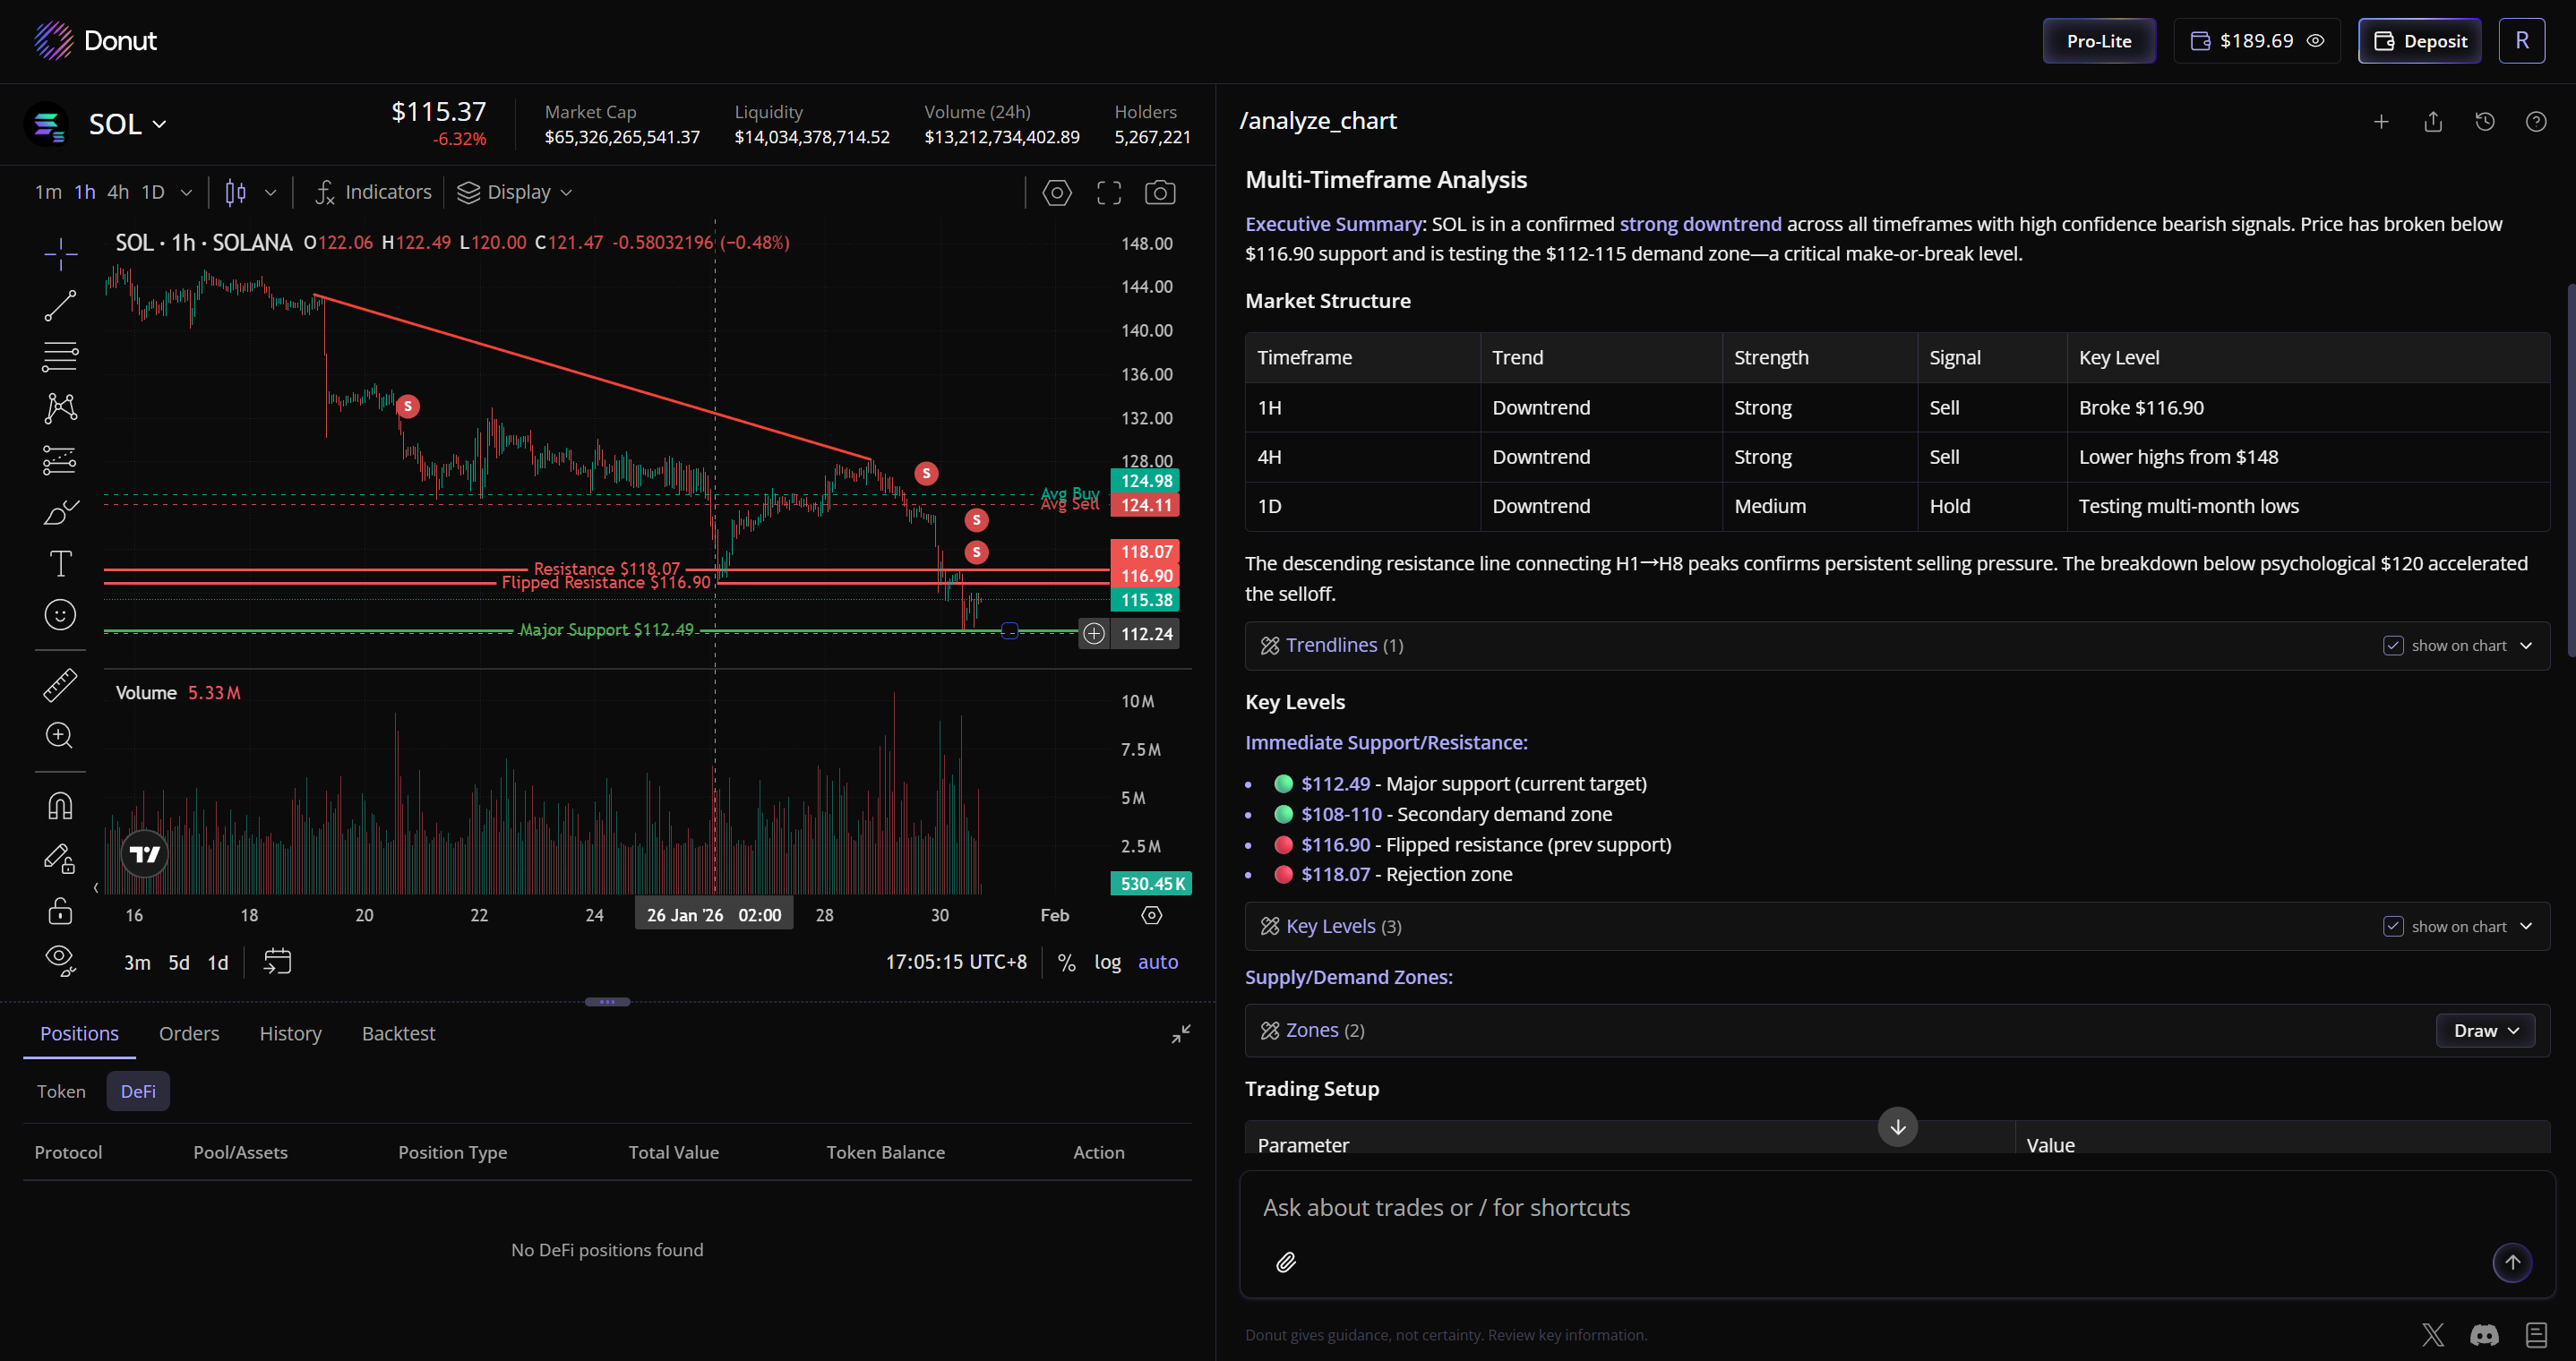
For example, in the images above, it analyzes the SOL candlestick chart, draws support and resistance lines, and records the analysis process. The chart layout can be adjusted, such as widening both side panels for better visibility.
You can ask Donut AI questions like:
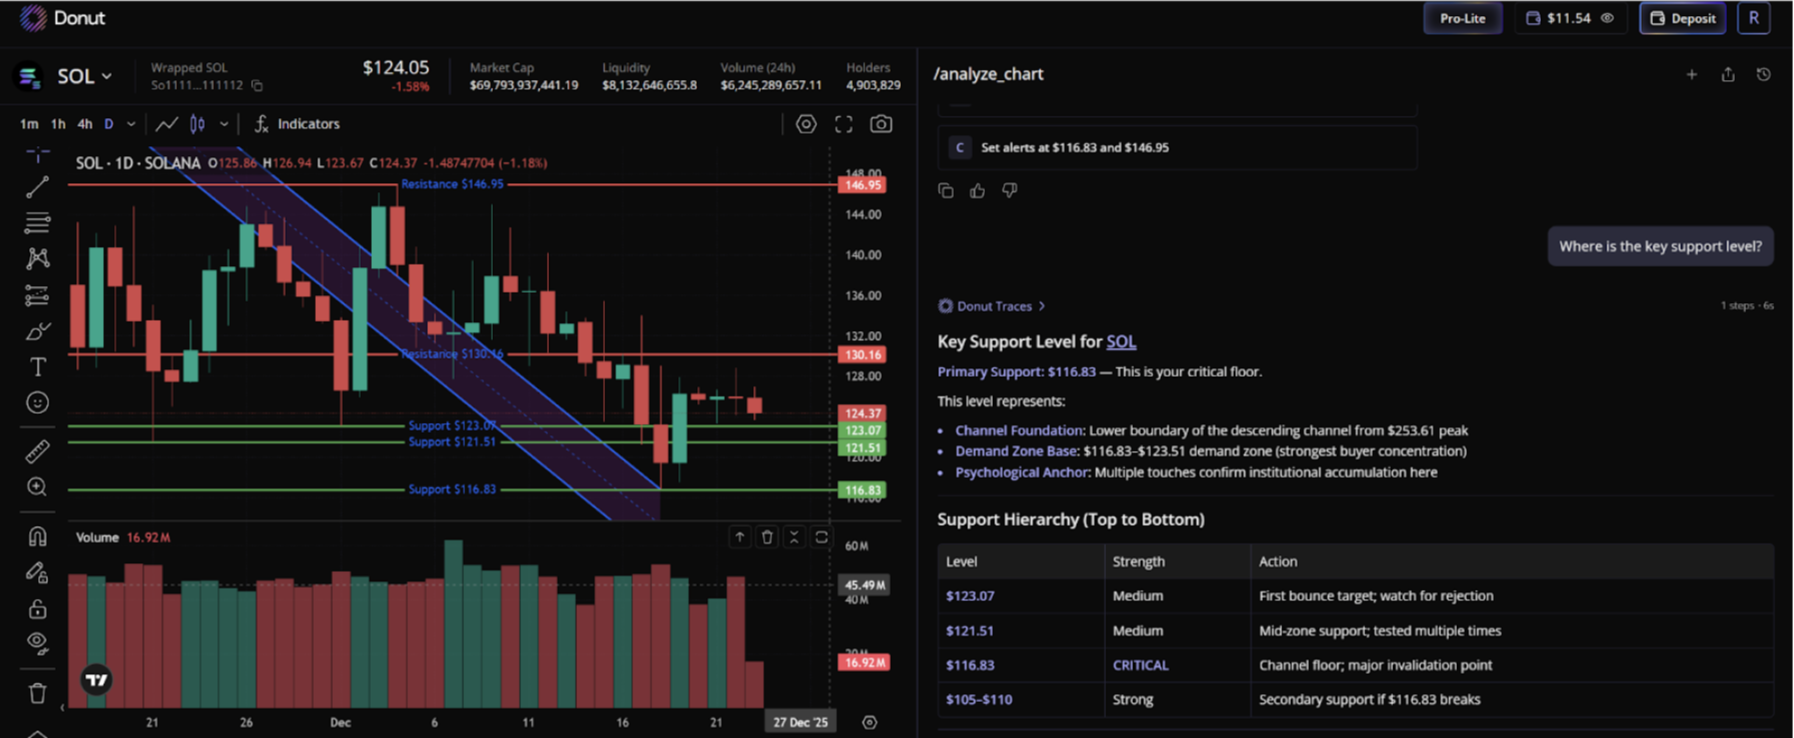
- “Where is the key support level?”
- “When would be a good time to buy?”
DCA Strategy Generation
You can also ask Donut AI to generate a DCA strategy based on your criteria.
For example: "Give me a DCA strategy for SOL below 120."
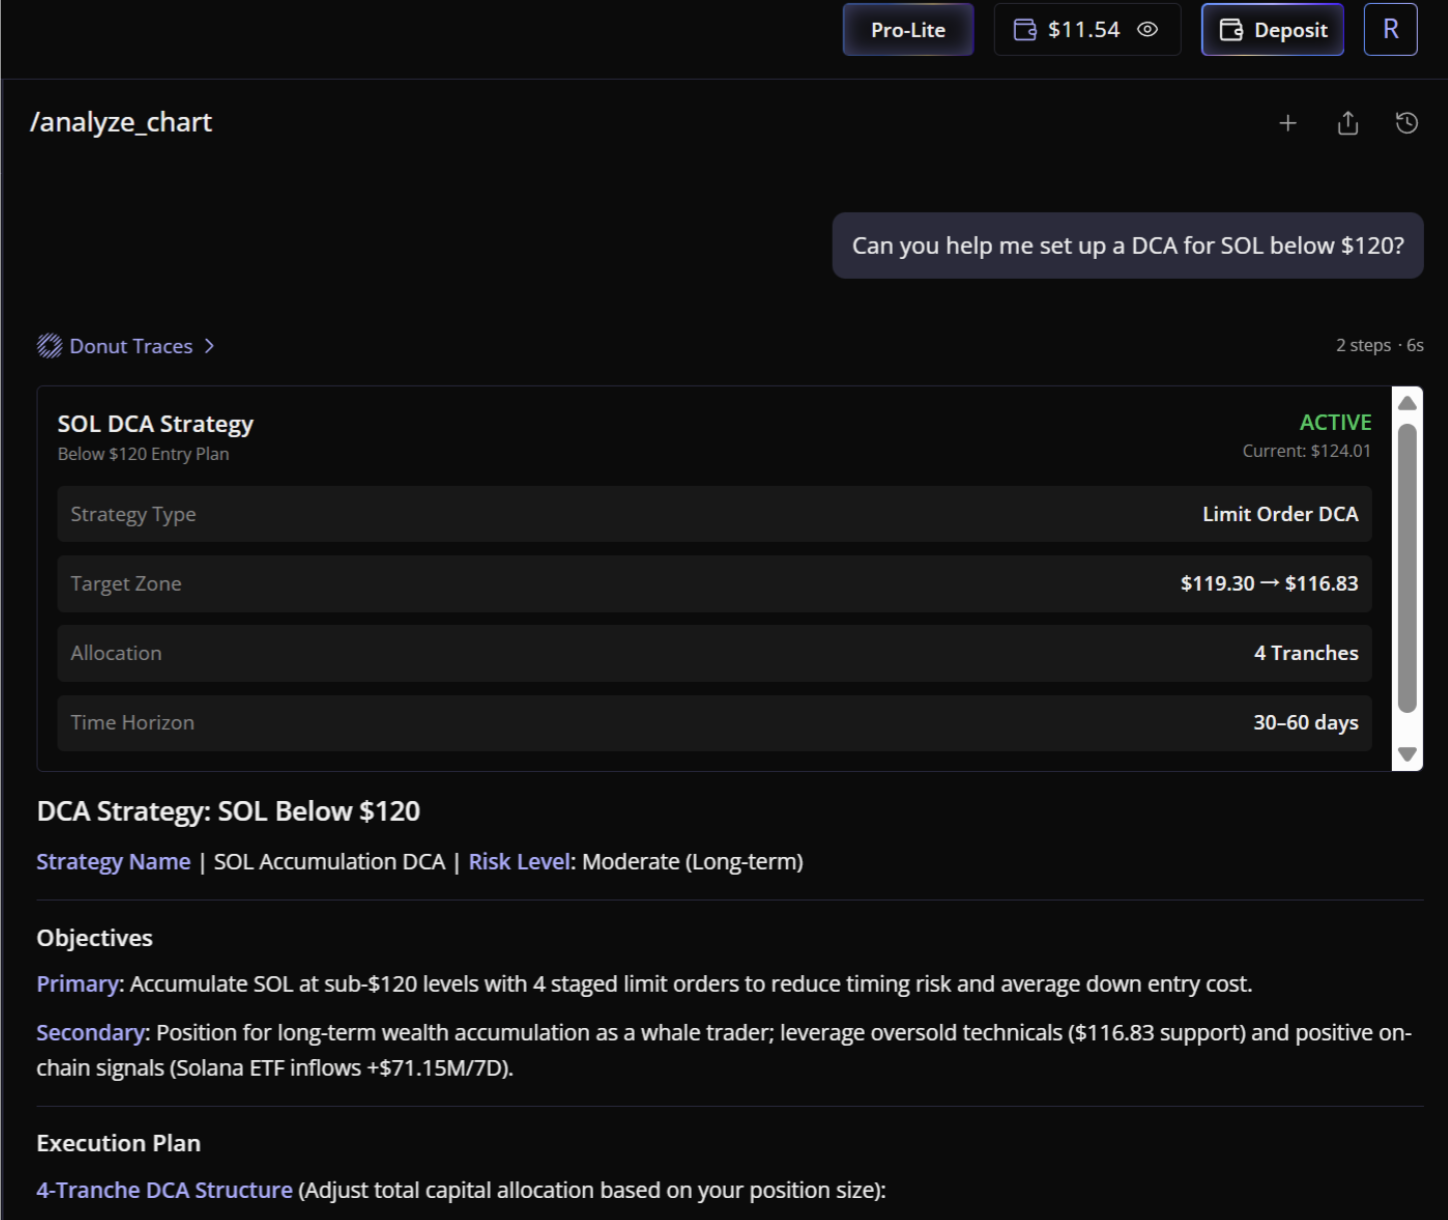
Execution only happens after you confirm.
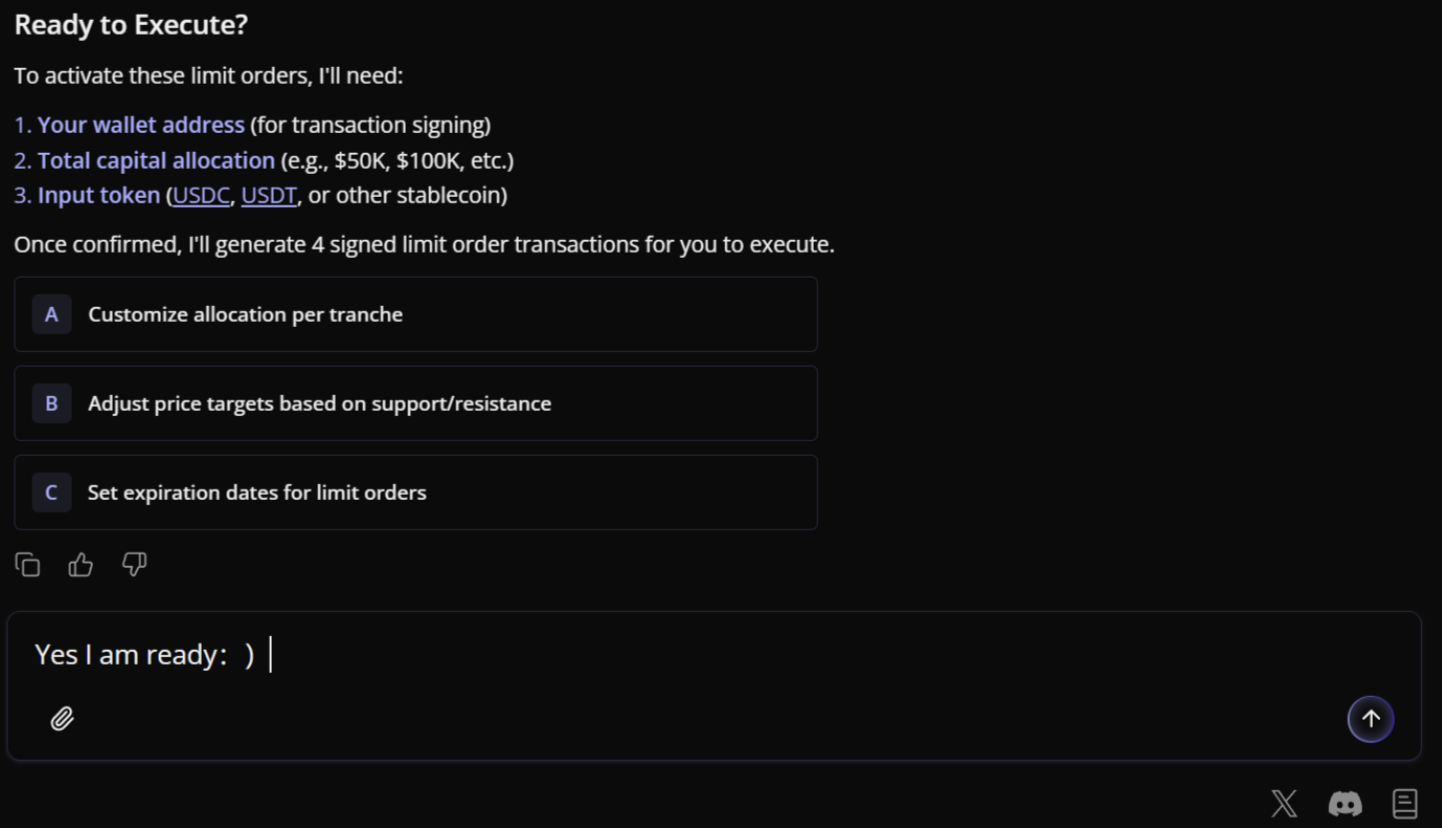
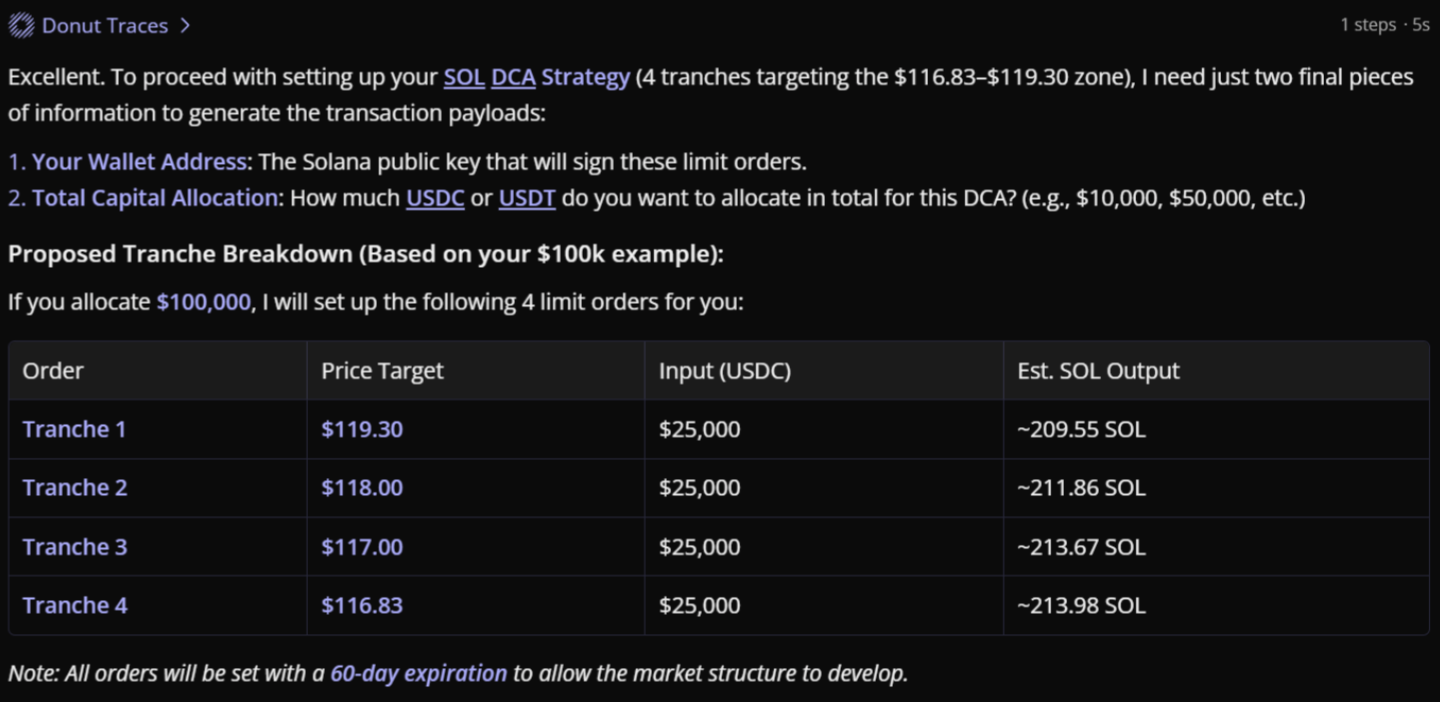
Donut will return a structured DCA plan, including:
- Suggested buy levels
- Allocation breakdown
- Execution intervals
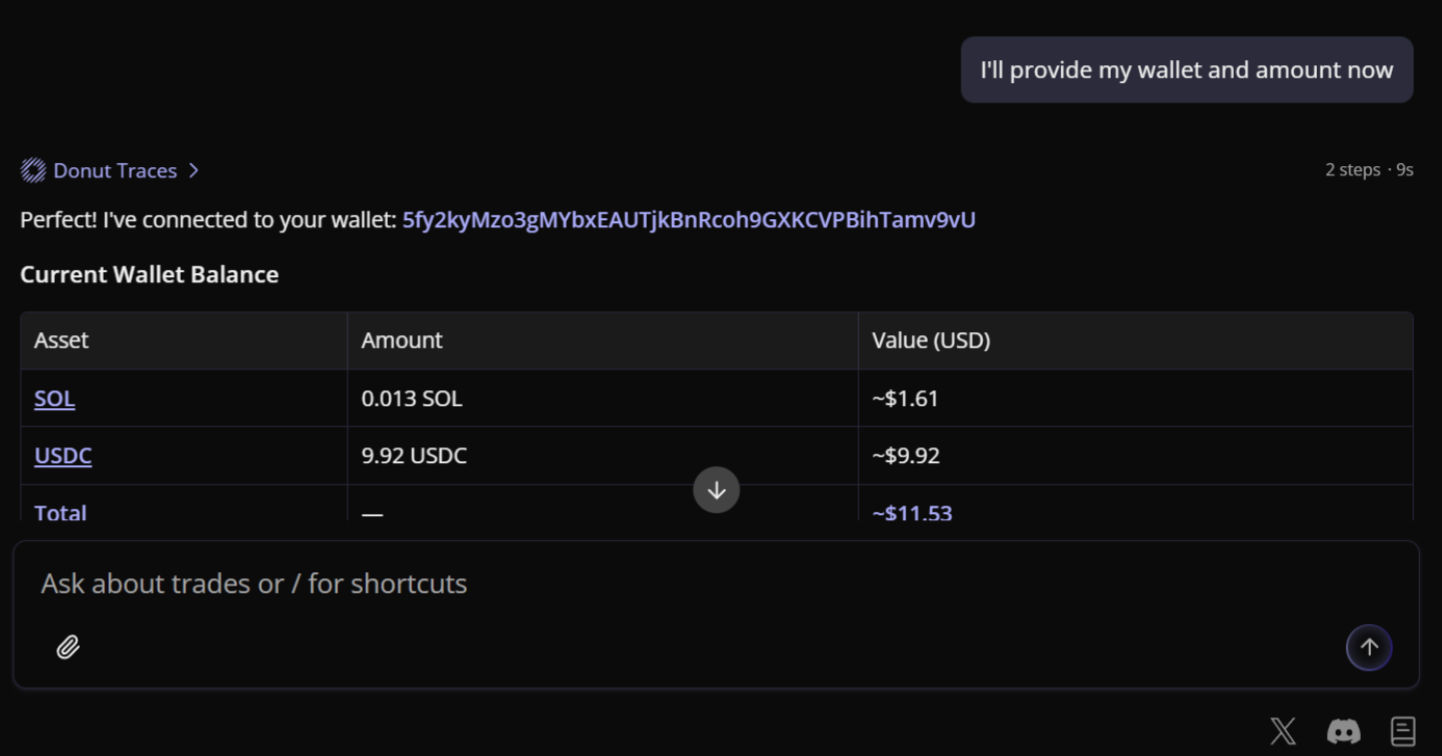
The strategy also includes a check of your current account balance, helping you plan execution more accurately.